

Introduction
The Cartesian coordinate system is named after the philosopher and mathematician René Descartes, considered the creator of analytical geometry.
This system allows us to represent points on a line, in the plane and in space using arrays of numbers. For example: (1,5), (-3,0), (4,1,-1), etc.
What is a Cartesian plane?
The Cartesian plane is defined by two straight lines perpendicular to each other, one horizontal and one vertical, these straight lines are known as Cartesian axes. Using these axes we can identify any point on the plane with a single ordered pair of numbers.
The horizontal axis is known as the abscissa axis and is usually the x-axis. The vertical axis is known as the ordinate axis and is usually the y-axis.
The point where the abscissa and ordinate axes are cut is known as coordinate origin or simply origin and is the point (0.0).
The following figure shows a Cartesian plane with the point (2,1) plotted.


Quadrants of the Cartesian plane
Quadrants are characteristic regions of the plane defined by changes in signs on coordinate axes.
There are four quadrants, the first is the upper right region and they are listed counterclockwise.


As shown in figure 2, quadrants are defined in the following regions.
First quadrant: { x > 0 , y > 0 }
Second quadrant: { x < 0 , y > 0 }
Third quadrant: { x < 0 , y < 0 }
Fourth quadrant: { x > 0 , y < 0 }
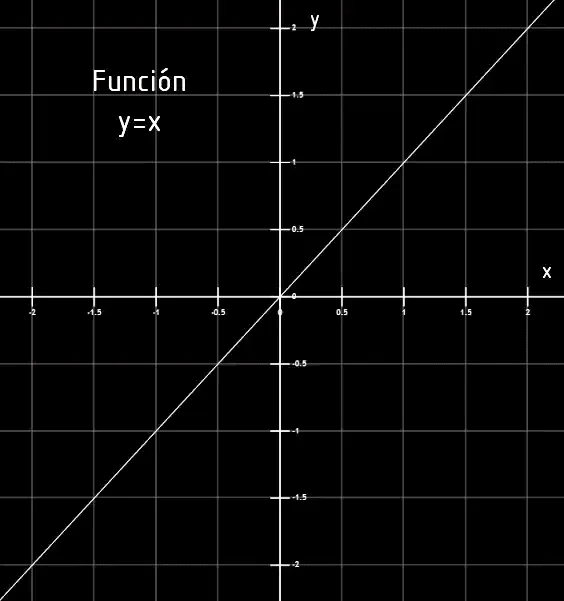
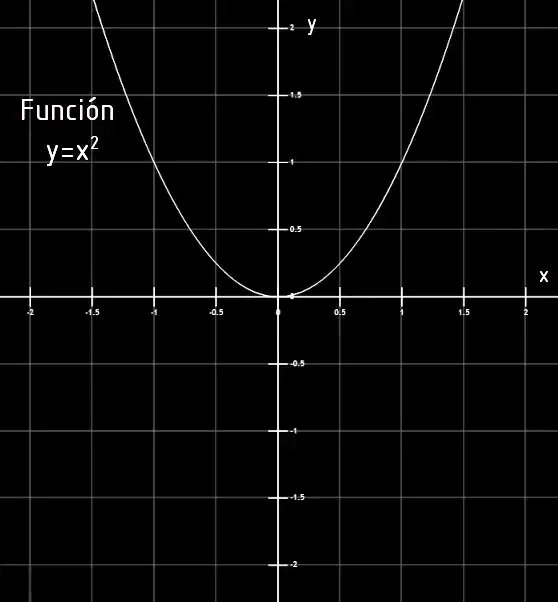
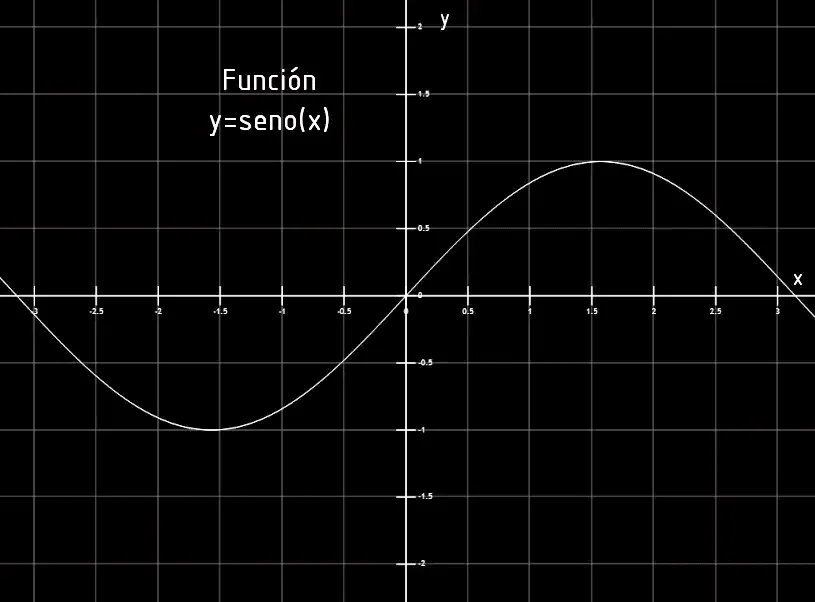
Representation of functions in the Cartesian plane
The Cartesian plane also serves to represent functions, i.e. rules that assign each point of the x-axis to a point of the y-axis. Figures 3 to 6 show some examples of function graphics in the Cartesian plane.


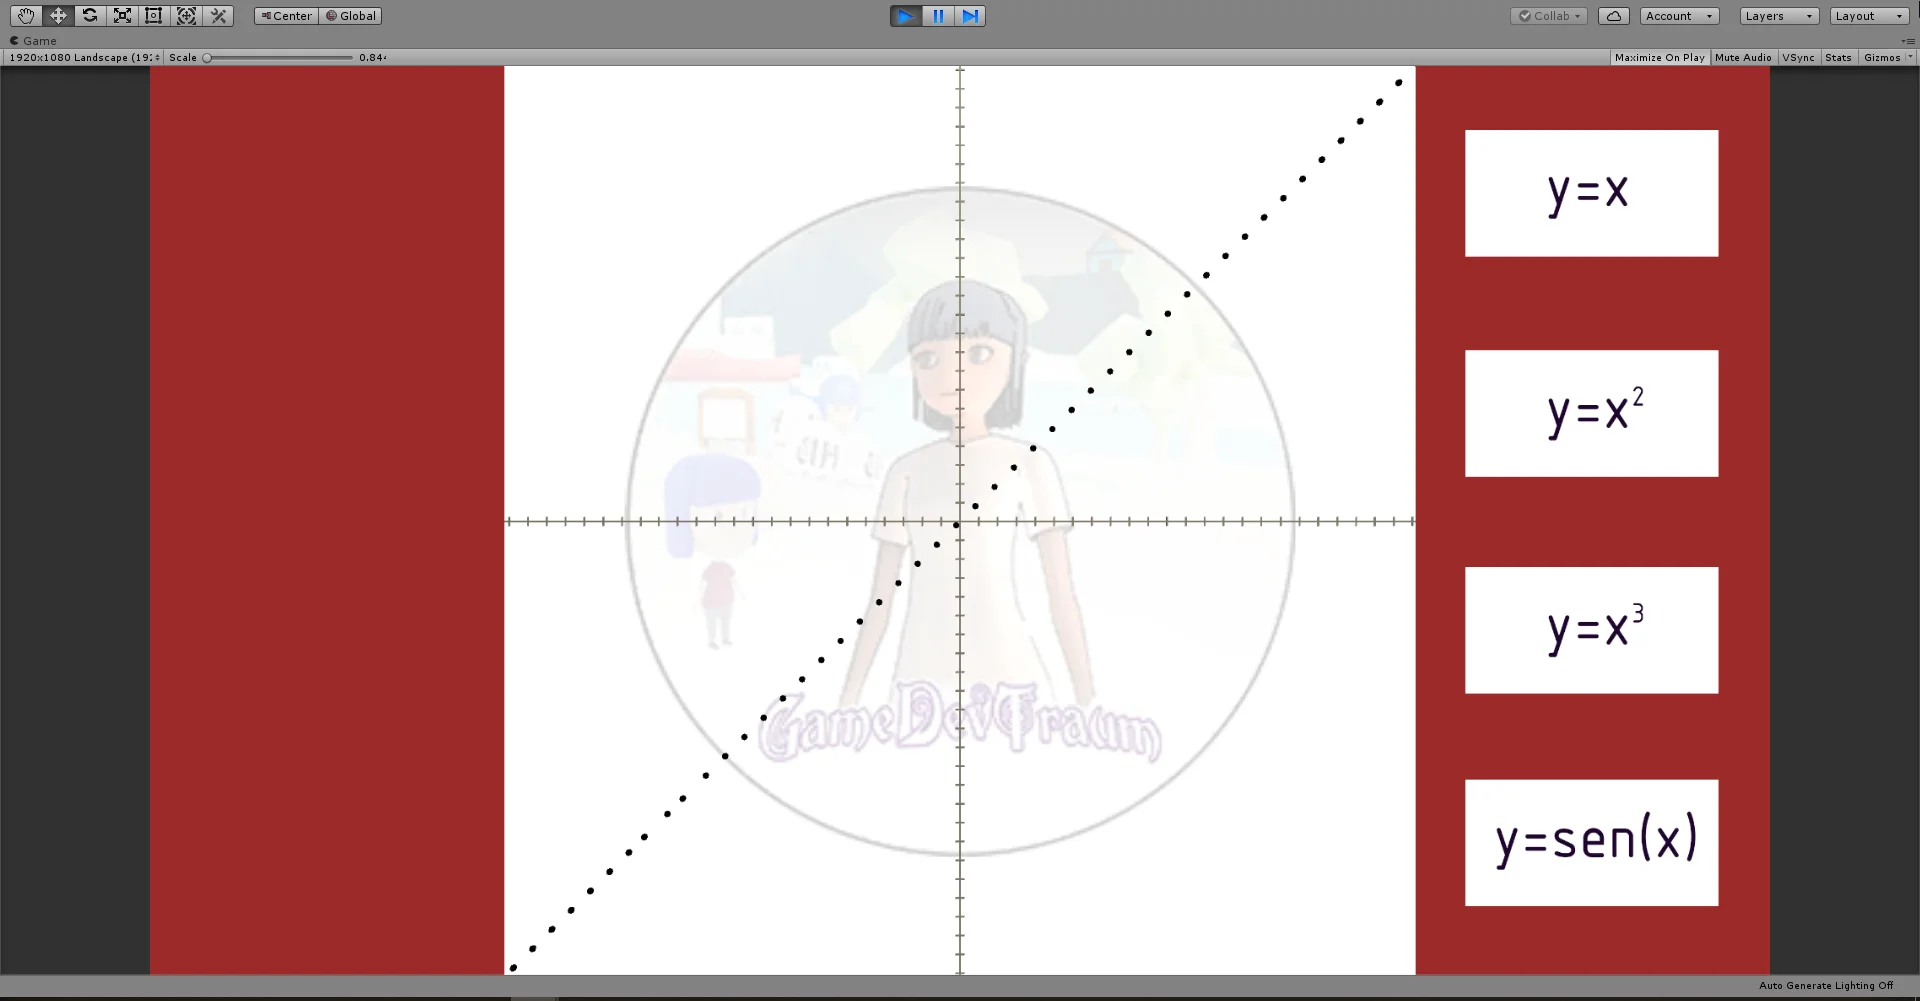
Cartesian system in Unity
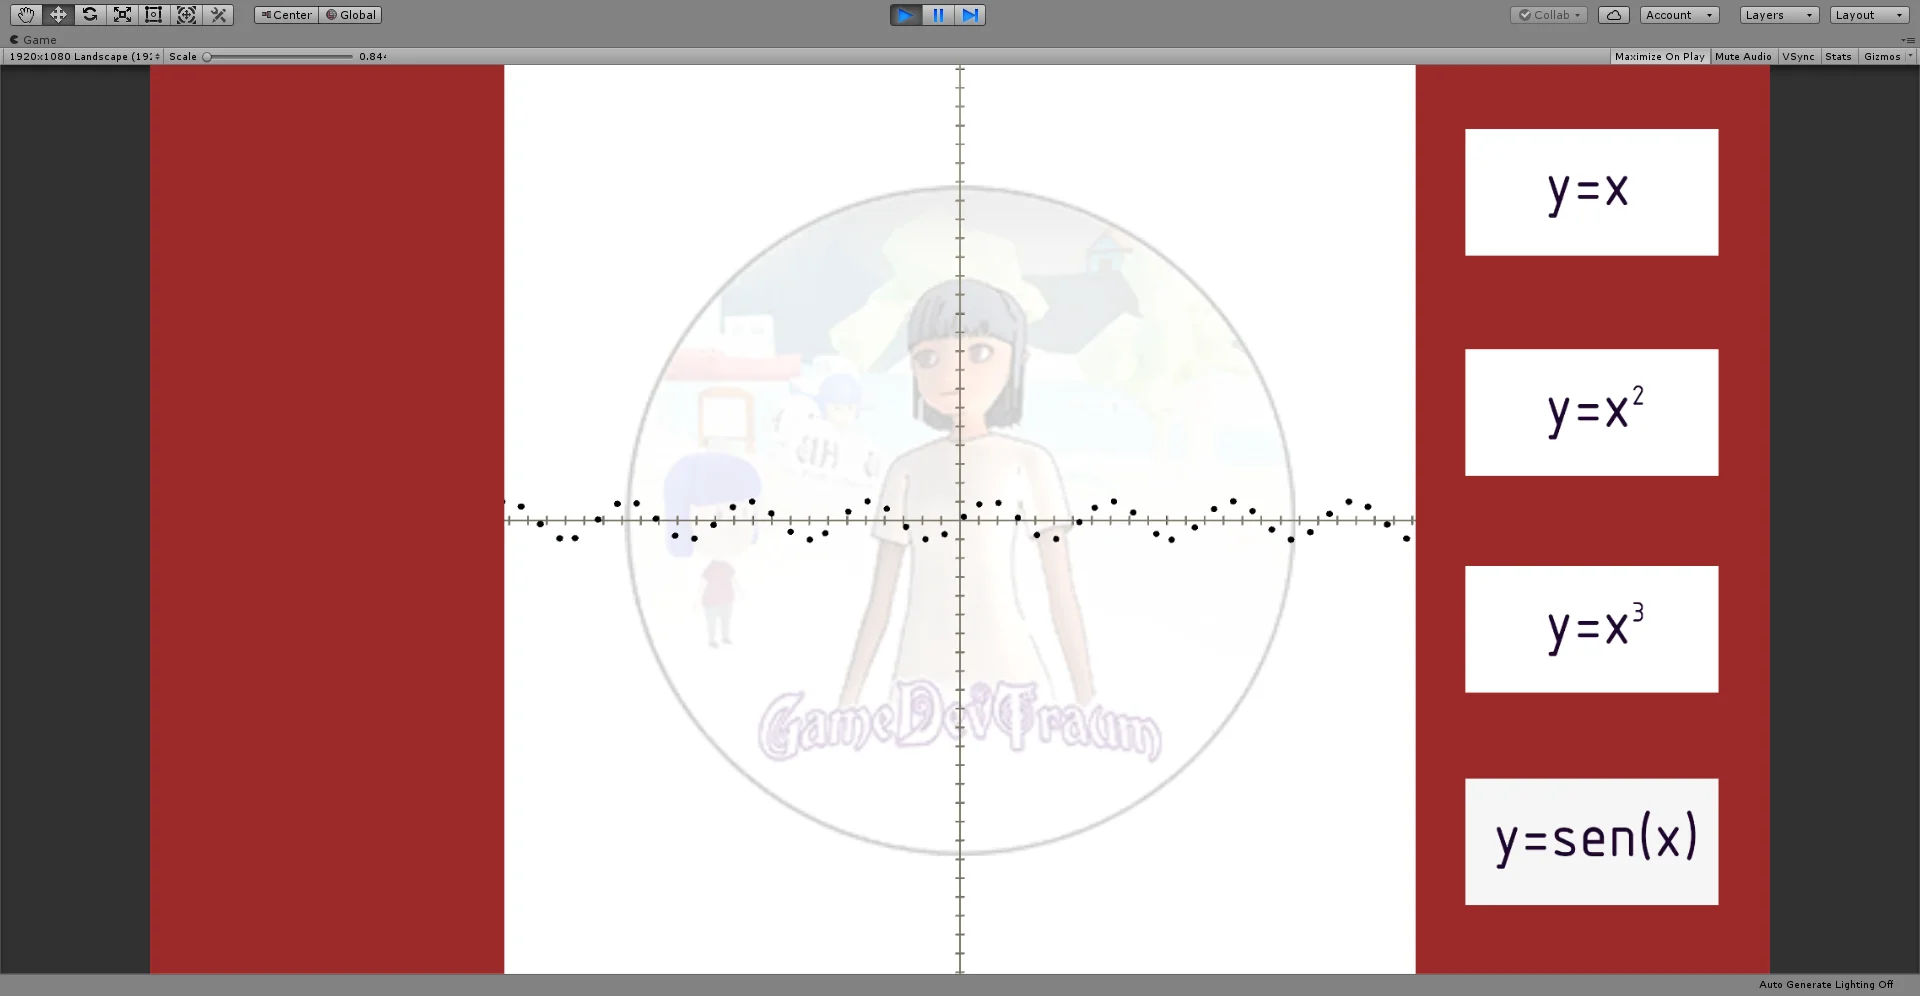
Cartesian coordinates are used in various places in Unity, for example to define the position of a GameObject in the plane or space. But for the purpose I wanted to make a simple function plotter using spheres that move on the x-axis and their position on the y-axis is calculated using the expression of the function.
The buttons allow us to change the expression of the function


Conclusion
Rectangular coordinates are often used in Unity.
Understanding how the Cartesian plane is used to represent points and functions in the plane, along with knowledge of analytical geometry can help us create new and interesting solutions.